

Find and fix what slows your operation. Fast.
For the first time, see and control how efficiently work moves between people, tools, and teams. Turn hidden drag into profit and reclaimed capacity. Proof in days. No integrations, downtime, or new hires.

Measure → Align → Prove
∞
Measure → Align → Prove ∞
Every organization leaks value it can’t see.
Most lose 20%+ of capacity to hidden friction. Existing methods like AI, BI, Lean, and consulting all look inside the system. The real losses hide between them. Qoherence measures that space directly, revealing where coordination breaks and how to restore flow at scale.


When coordination breaks down, performance decays quietly. Legacy tools show what happened. Qoherence reveals the hidden flow between systems and quantifies the efficiency and value you can reclaim.
Real data. Real results.
We analyzed a city-scale dataset from New York City’s 311 system to test a simple question: can coordination be measured from operational data? Using existing system activity alone, Qoherence extracted a clear signal of how teams and processes actually move work through time.
1. Seeing Coordination
Departments with higher scores resolved issues several times faster, showing that coordination quality, not policy or staffing, predicts efficiency and throughput. Every insight came from data already available, with no integrations or system changes required.
2. Performance Signal
This example is one of many environments where the same pattern appears. Wherever work moves through time, Qoherence makes hidden coordination visible and turns it into measurable, actionable improvement.
3. Repeatable Results
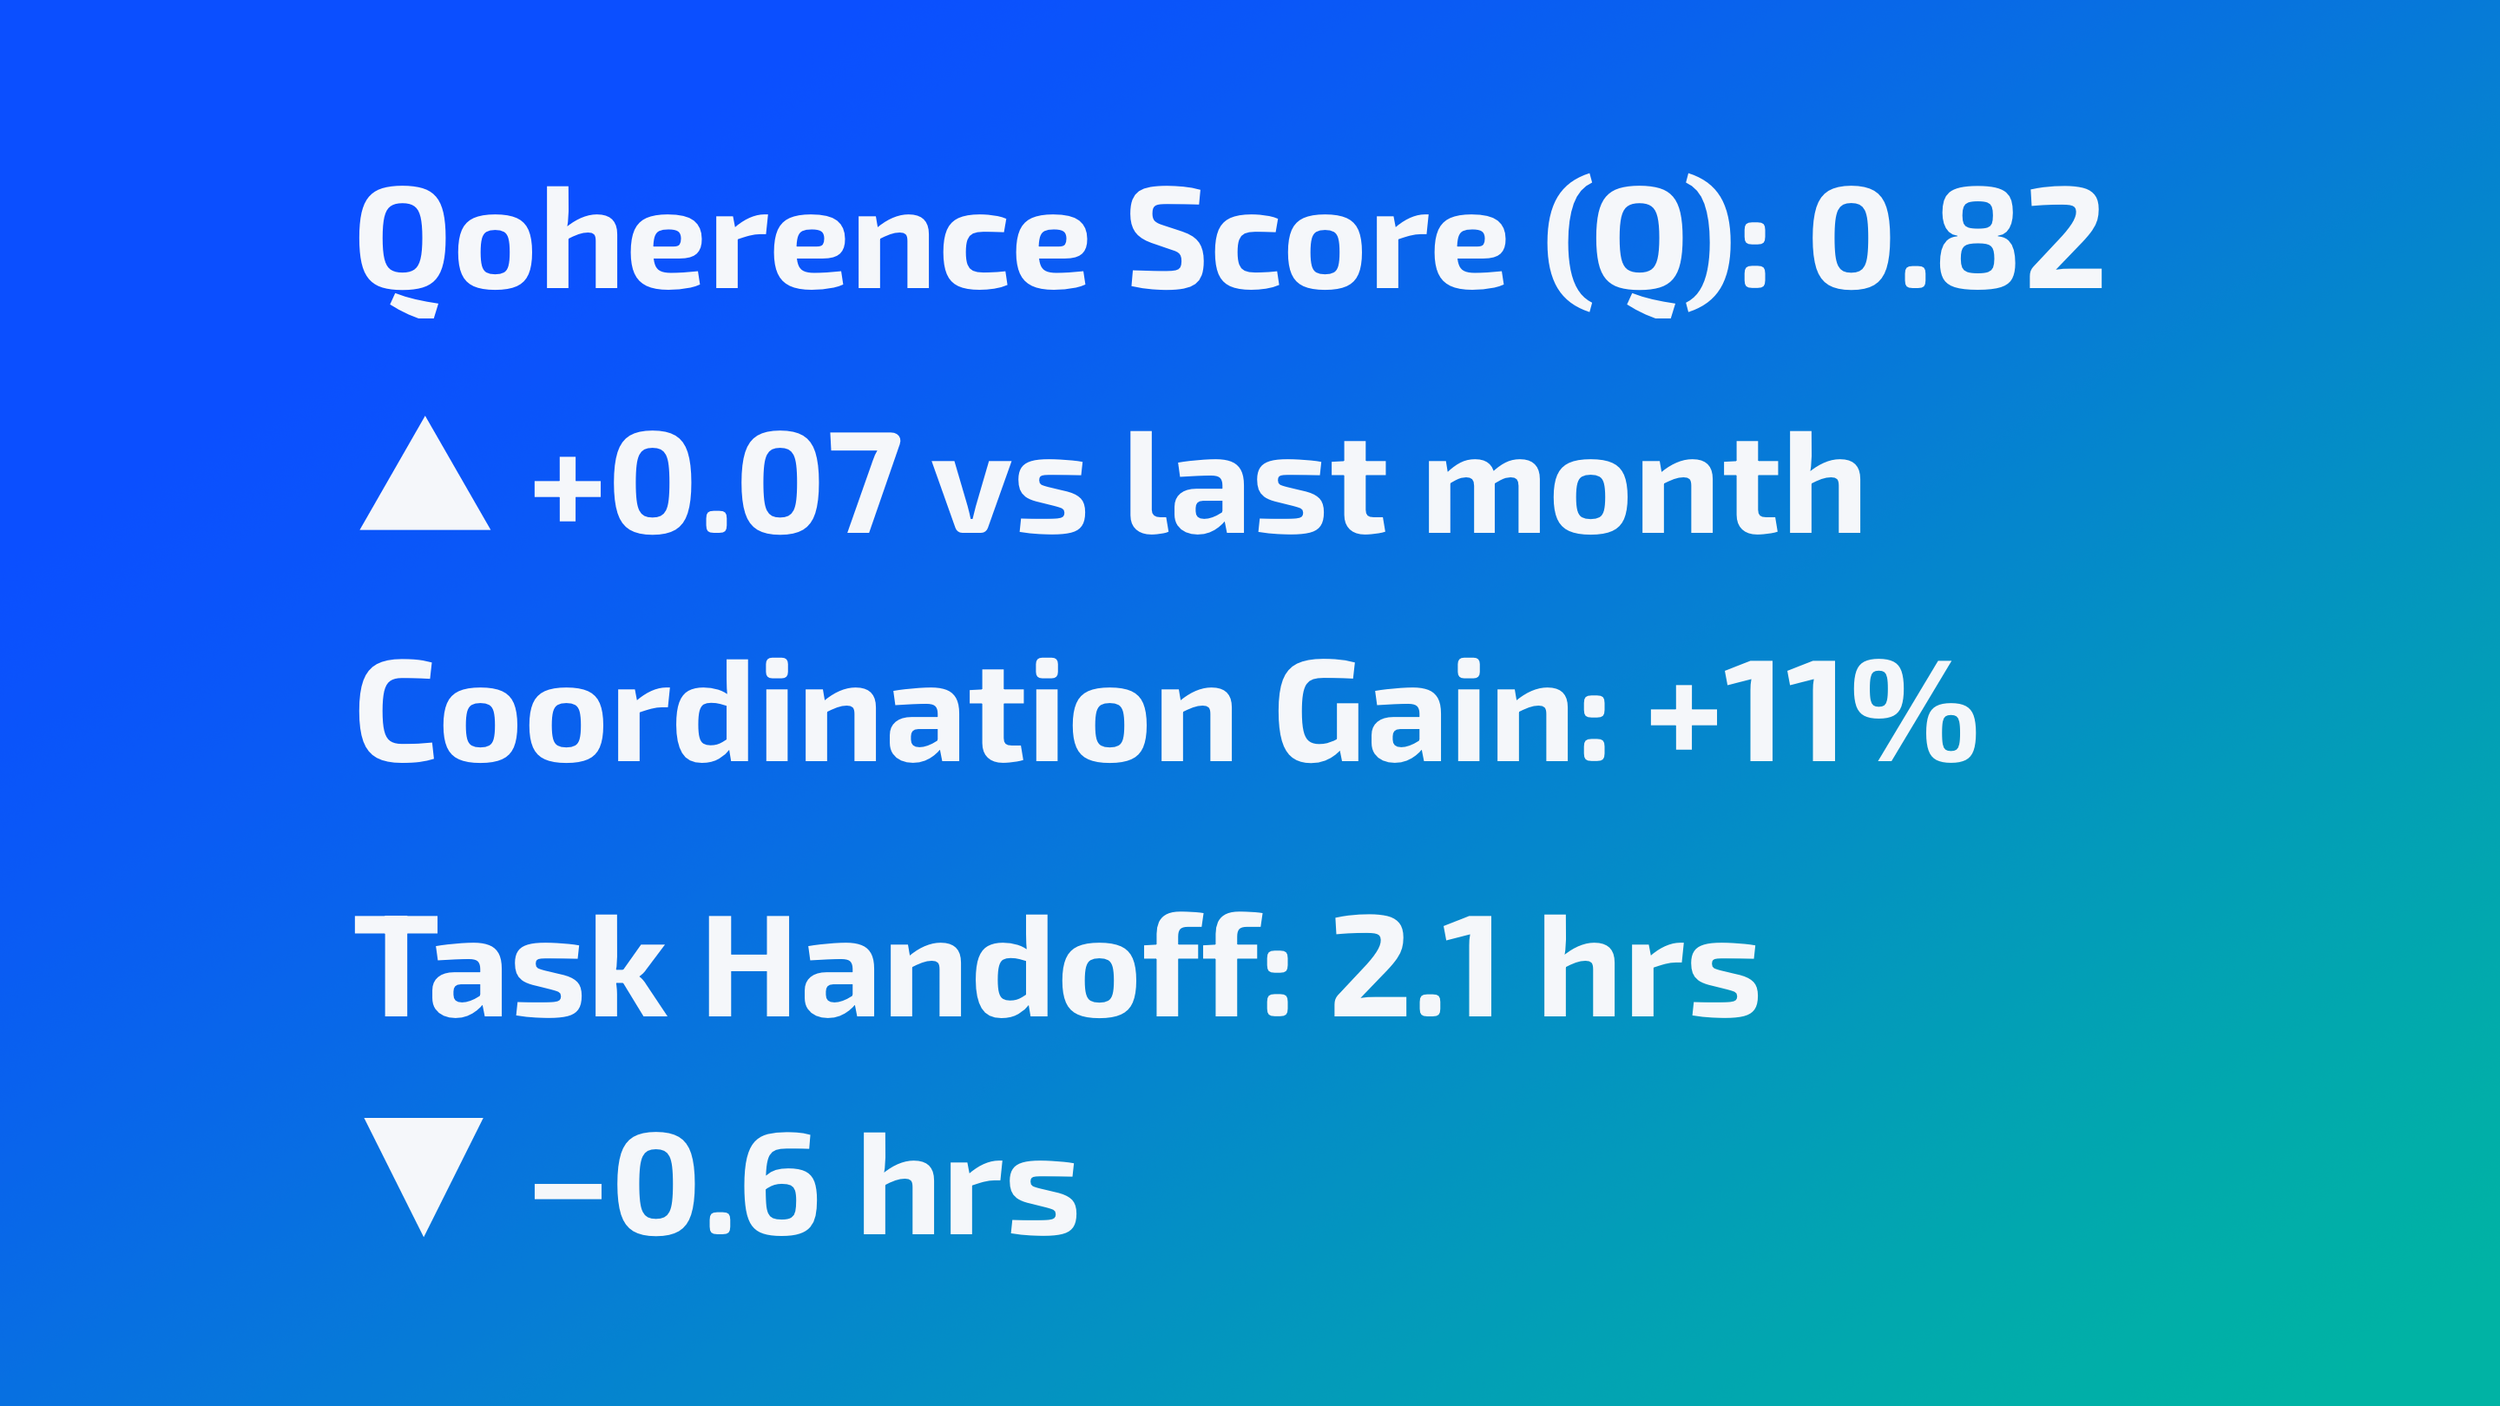
The first KPI for coordination.
Qoherence distills your existing data into a single performance signal that reveals how well your teams and systems work together. Each scan pinpoints coordination loss and prescribes focused moves that restore flow fast.
No integrations or workflow changes
Privacy-first (metadata only)
Proof inside your own data in days
Improve Systems
-
We scan one workflow from your existing data and calculate your first Qoherence Score™. You see exactly where time and capacity are being lost.
-
A short report that visualizes hidden friction, duplication, and delay across teams and tools, with clear lift opportunities.
-
No integrations, no workflow changes, no IT spend. The pilot runs entirely on metadata from systems you already use.
-
Leaders who want measurable results without disruption, ideal for operations, tech, and civic teams managing high-volume work.
-
Within a week you’ll have your Qoherence Score™, a structural map of friction points, and the three moves that raise it.